Squid Data Hub · Energy Balance
Energy Balance
Do your sources reliably cover your consumers?
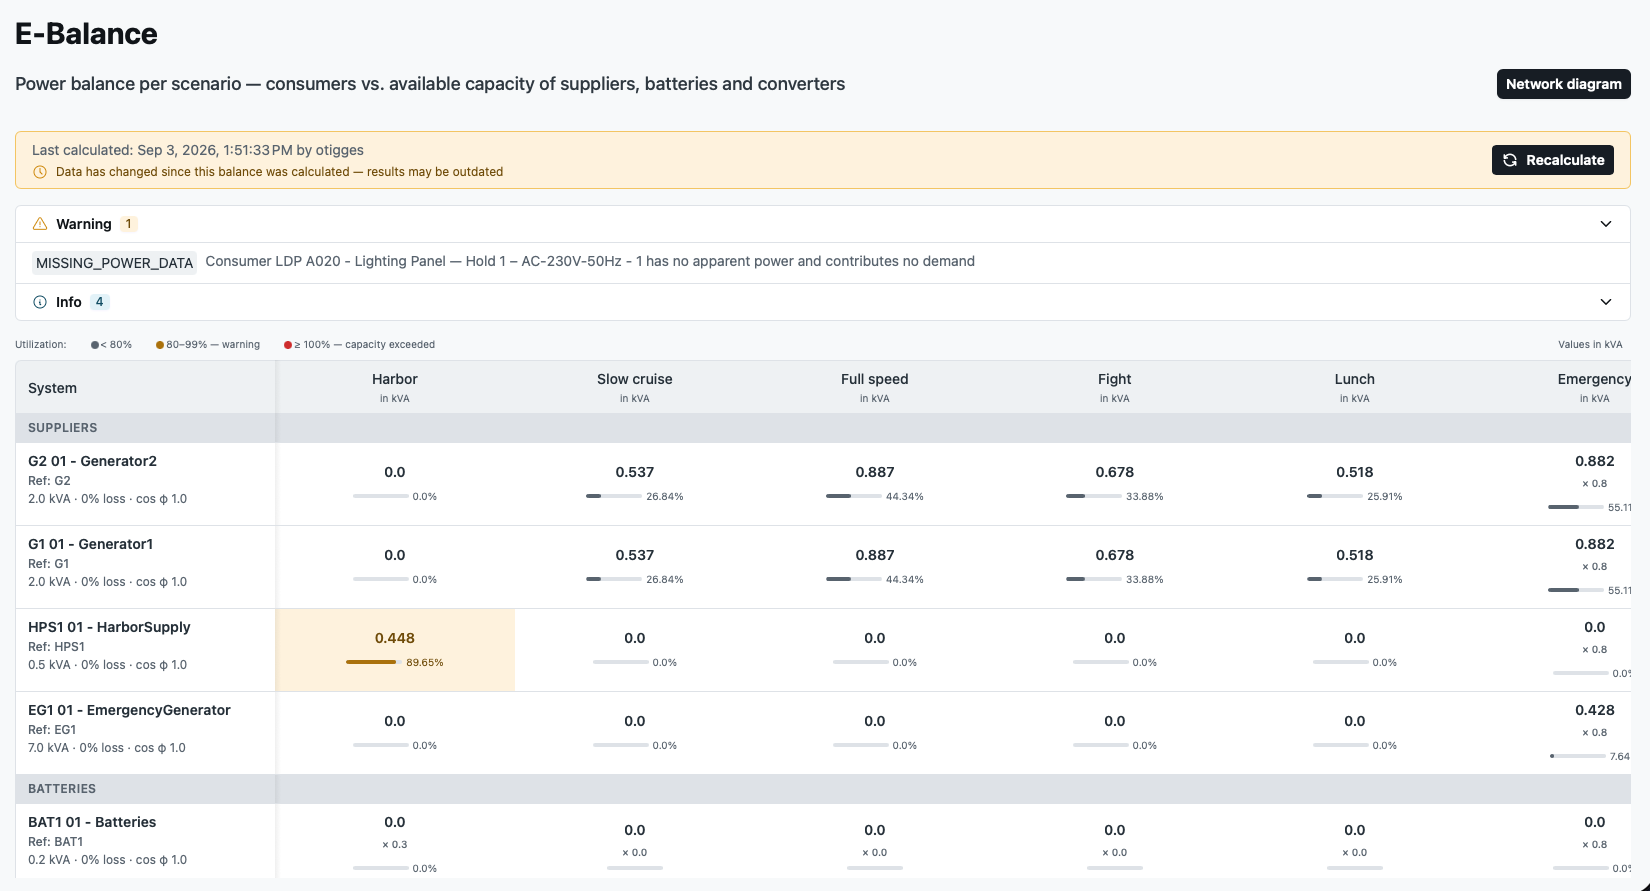
Every electrical system runs on one question: can your generators, batteries, and converters carry every consumer, under the conditions that matter? An energy balance makes that answer transparent – a shared basis for engineering, project management, suppliers, operators, and inspectors, not a number buried in a spreadsheet.
Why it matters
One transparent answer, not a spreadsheet.
- Verify correct sizing of generators, batteries, converters, switchboards, cables
- Understand peak loads and load distribution
- Ensure redundancy and fault tolerance, especially in isolated grids
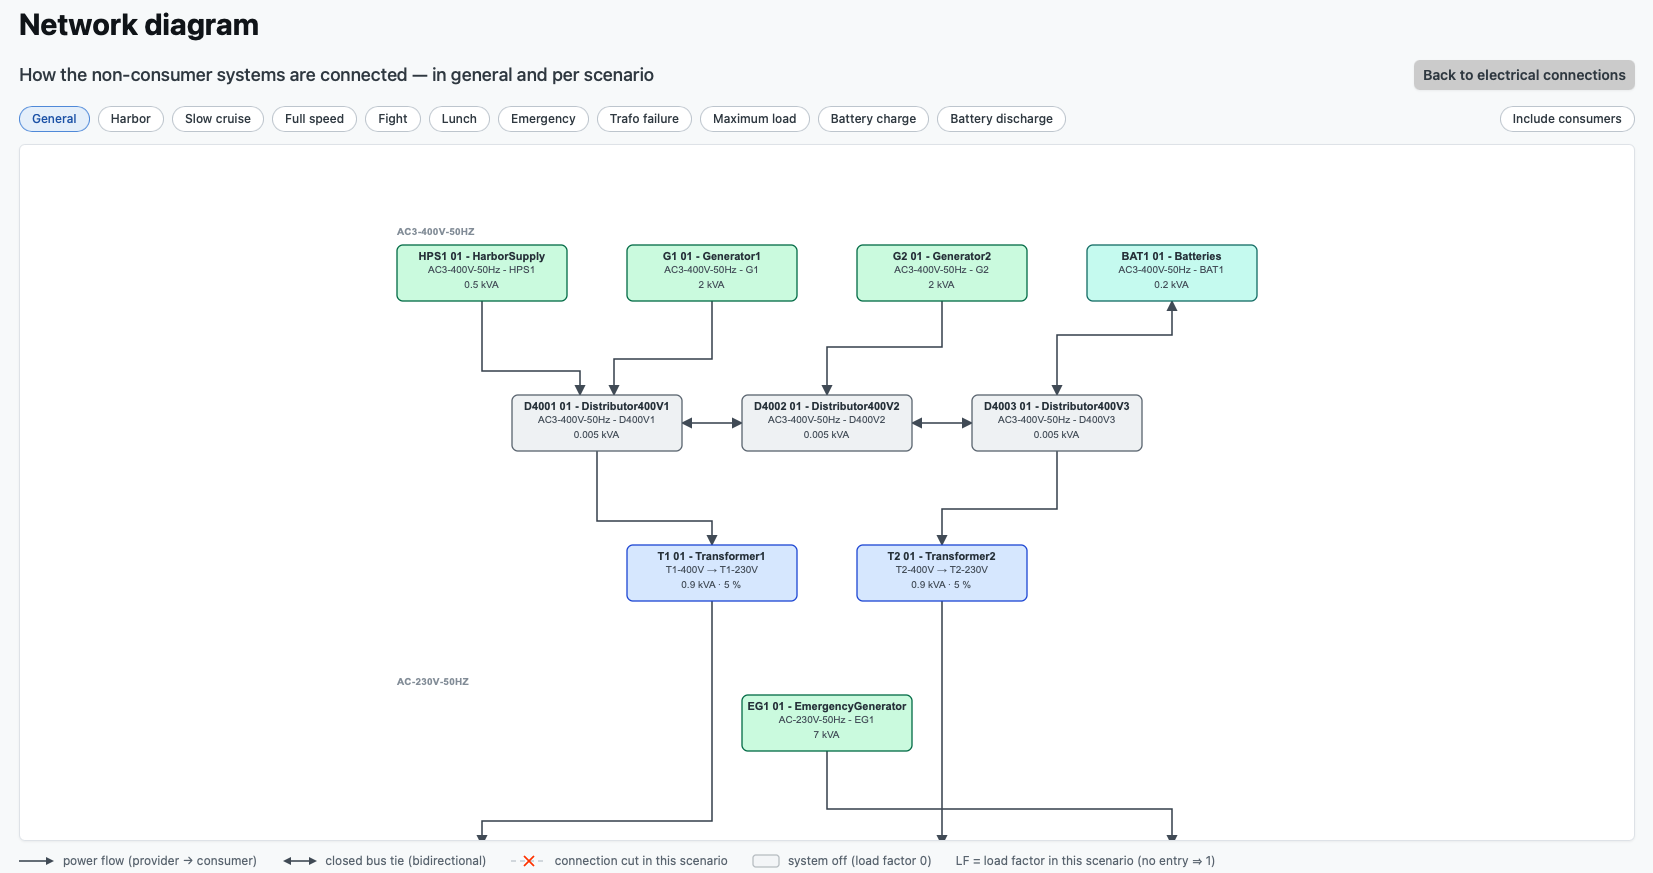
- Model normal, emergency, and redundant supply paths explicitly, not as an afterthought
- Support certification, audits, and regulatory approval
Stays accurate as your design changes
Your load balance doesn't go stale the moment a device, system, or connection changes – it stays current automatically, without rebuilding a spreadsheet from scratch every time something moves. Devices that serve more than one role or run on more than one electrical system are handled the same way, without extra workarounds.
Every scenario, side by side
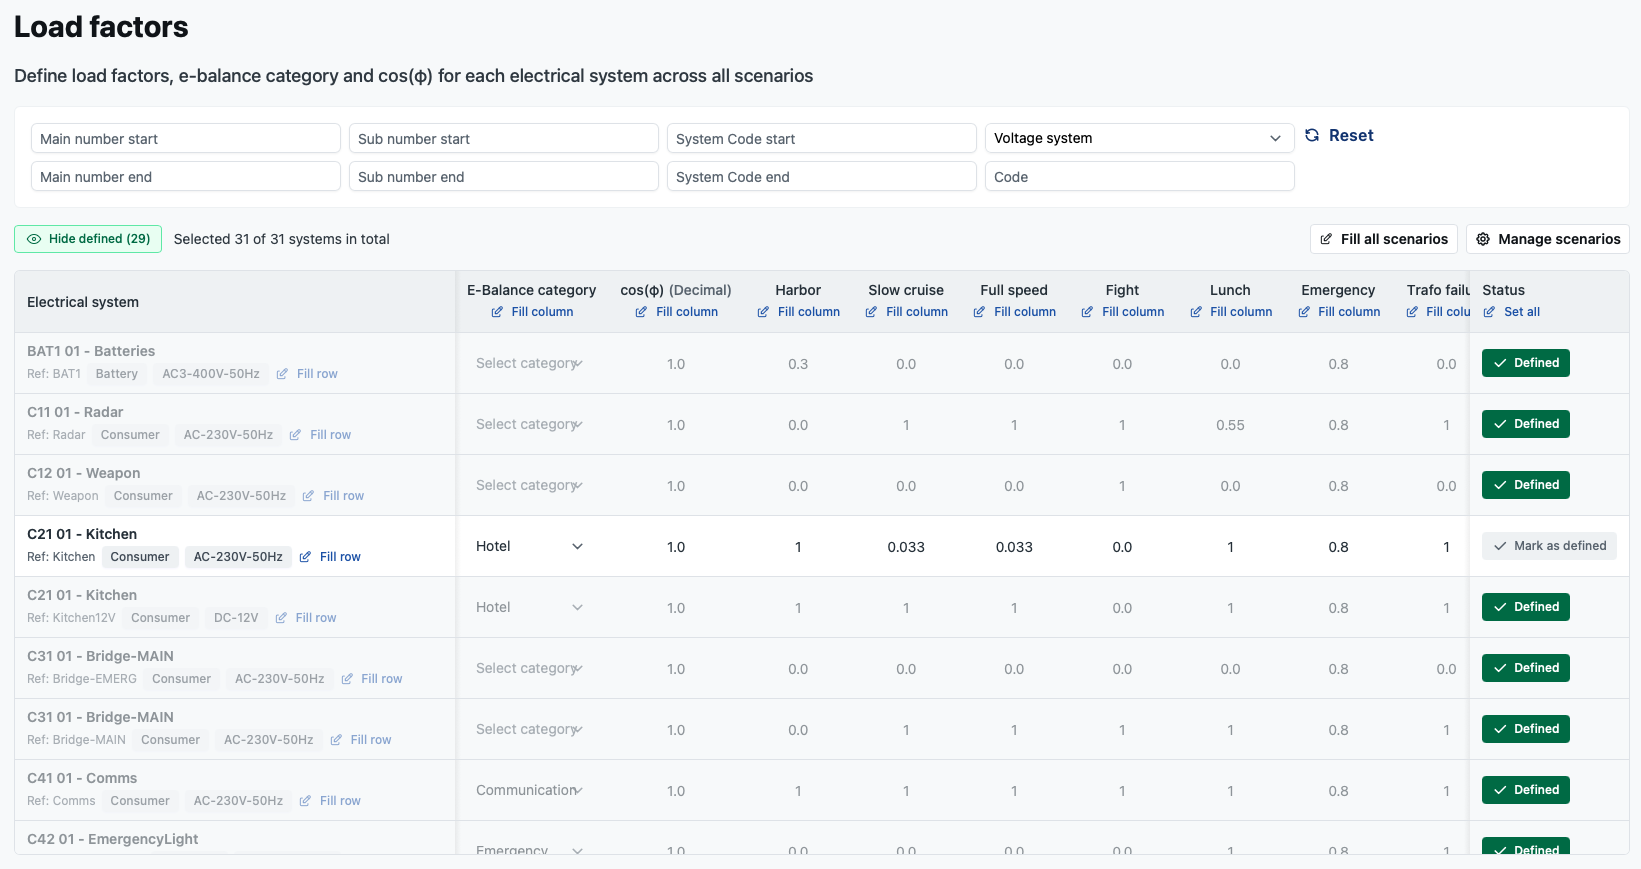
See normal operation, peak load, and emergency supply evaluated side by side – for exactly the operating conditions your project needs, whether that's harbour, sea, manoeuvring, or a scenario unique to your plant or vessel. Nothing is limited to a fixed, predefined list.
One number everyone can trust
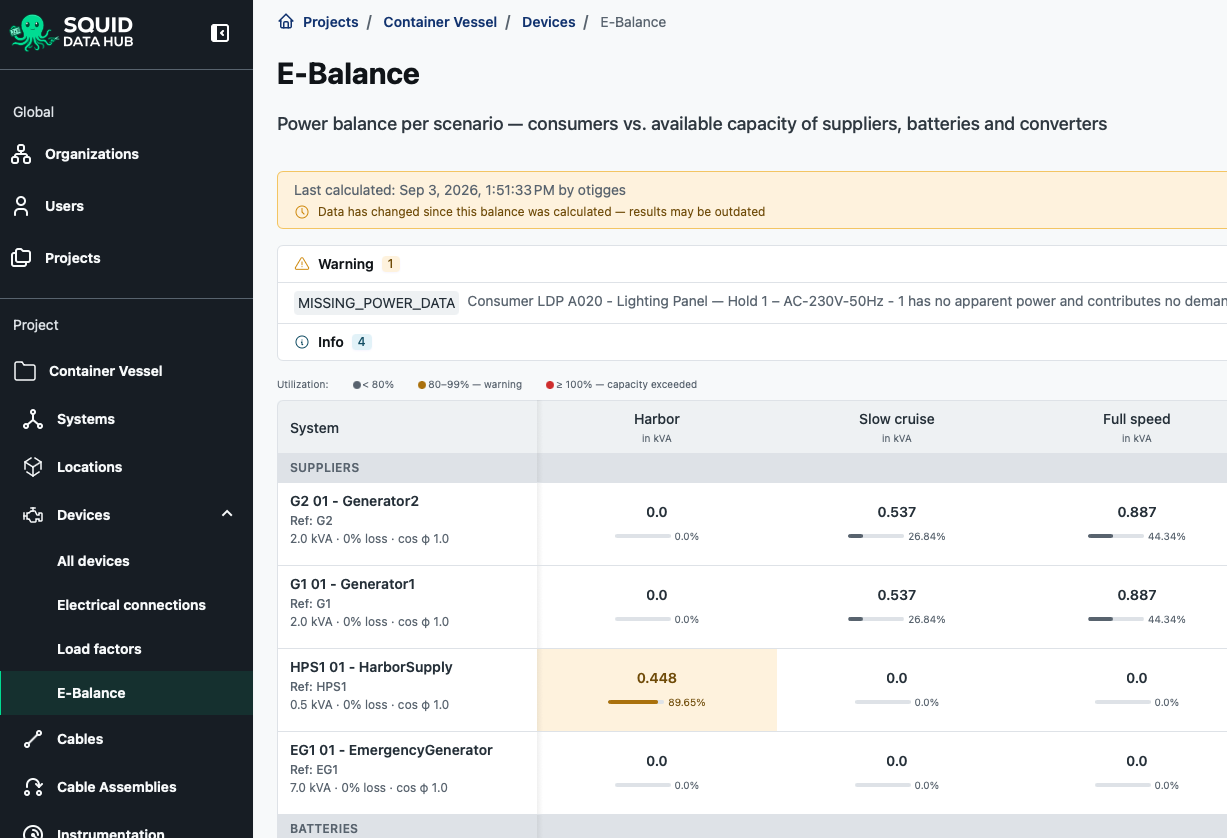
Drawings and calculations never quietly drift apart. Whatever changes in your engineering data, there's exactly one current, authoritative energy balance – ready for your own team, your suppliers, and your classification society, not just for whoever built the last spreadsheet.
Export results as PDF for documentation and classification, or Excel for further analysis, at both device and system level – whenever a milestone or an audit needs them, not only at the end of the project.(Richer scenario tooling – comparing alternative setups before committing to one – is next on the roadmap.)
One principle, every industry
Not just a maritime concept.
Maritime
Industrial plants
Buildings & facilities
Who uses it
Electrical engineers · Project & commissioning teams · Operators · Classification societies & regulators · Customers needing traceable design decisions
Want this running on your own data in a week? See E-Balance in a Week →
Let's talk about where your engineering data actually stands today.
A personalized demo scoped to your environment and use case, and an integration approach aligned with your existing systems.